ESPN reported on April 12, 2026, that AI revolutionizes NFL draft data visualization. Teams blend machine learning with advanced charts. Scouts sharpen talent evaluation through clearer insights.
Traditional scouts relied on game tape and stopwatches. AI processes vast datasets, including biomechanical metrics and simulations. Visualizations make these insights accessible.
Traditional Scouting Meets AI Insights
NFL teams long evaluated prospects via subjective film study. Coaches assessed traits like footwork and burst. Data remained anecdotal.
AI changes this. Algorithms analyze 50,000 motion capture points per NFL prospect game, per ESPN on April 12, 2026. Dashboards distill complexity into patterns.
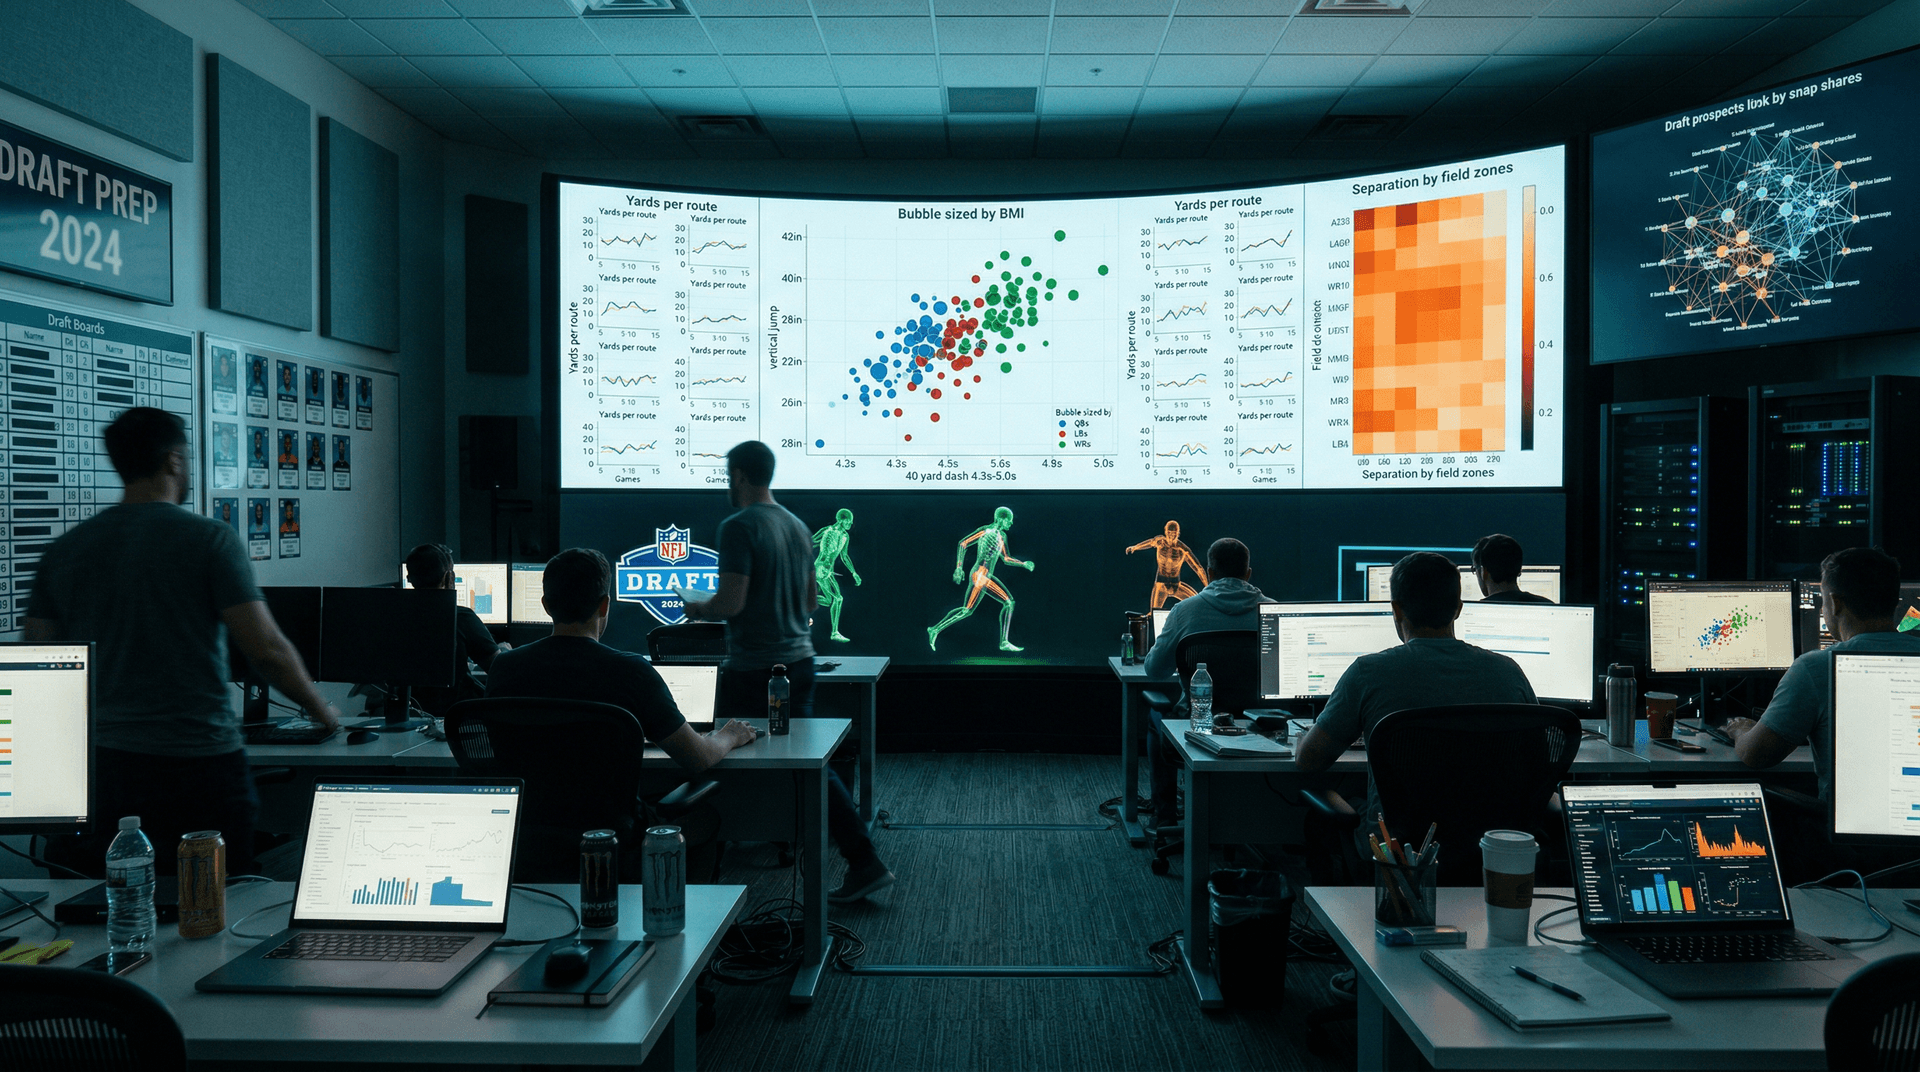
The Philadelphia Eagles deploy AI models. These models predict NFL success from college stats. Scatter plots (source: team internal Next Gen Stats, 2023-2026 college seasons) reveal correlations between 40-yard dash times and yards after catch.
Perception Science Shapes NFL Draft Data Visualization
Human vision excels at position and color, per Cleveland and McGill (1984). Sports visuals exploit these channels.
Scatter plots outperform tables for clusters in speed versus agility data. Color codes positions: blue for quarterbacks, red for linebackers. Viewers detect outliers instantly.
Stephen Few's data-ink ratio guides designs. Teams remove gridlines from heatmaps of receiver separation (source: NFL Next Gen Stats, 2025 season). Ink highlights player paths across zones.
Real-World NFL Draft Data Visualization Dashboards
A Tableau dashboard uses small multiples. Each panel tracks one prospect's route-running efficiency over 20 games. Lines plot separation yards gained (source: college tracking data, 2024-2026).
ESPN critiqued a 2025 dashboard. It featured overlapping 3D bars for combine metrics. Viewers struggled to compare vertical jumps across positions.
Teams redesign with layered bar charts. Horizontal bars show raw numbers. Dots overlay percentiles. Users clearly compare 35-inch wide receiver jumps to 30-inch tight end jumps.
Charts for AI Model Outputs
Machine learning yields probabilistic forecasts. A random forest model predicts 8.5% sack rate with confidence intervals (95% CI: 6.2%-10.8%).
Violin plots depict distributions from 1,000 simulations. Narrow shapes signal reliable tacklers; wide ones indicate boom-bust edge rushers.
Power BI integrates these visuals. Filters slice by scheme: zone versus man. AI flags 75th percentile EPA per dropback prospects (source: Next Gen Stats, 2023-2026).
Network graphs map teammates. Nodes represent players; edges weigh shared snaps. Centrality scores identify leaders for culture fit.
Pitfalls in Sports Visualizations
Pie charts mar draft previews. One graphic sliced prospect value into speed, strength, and IQ. Distorted slices misled on a 25% speed edge.
Sorted bar charts replace pies. Lengths convey scores directly. Edward Tufte's lie factor nears zero.
Overloaded dashboards fail. ESPN highlighted one cramming 12 metrics. Cognitive load overwhelmed analysts.
Stephen Few recommends single-purpose charts. A slope graph shows cornerback jam effectiveness via pre- and post-snap speed deltas.
Technology Stack for NFL Draft Prep
Tableau and Power BI lead NFL offices. Python's Plotly builds interactive prototypes. D3.js crafts custom draft board networks.
DataRobot automates feature engineering. It ranks 200 wearable variables. Importance plots prioritize pass-rush win rate over bench press.
AWS SageMaker trains on petabytes of snaps. Dashboards update real-time post-pro day, April 12, 2026.
Finance: Betting Markets and NFL Draft Data Visualization
AI visualizations refine NFL draft prop bets. Books adjust rookie sack lines on model outputs. Vig falls from 10% to 7% (Pinnacle odds, April 12, 2026).
Crypto platforms amplify edges. BTC trades at $71,712 USD (down 1.8%). ETH at $2,219.94 USD (down 1.3%), per CoinMarketCap, April 12, 2026.
Fear & Greed Index hits 16 (Extreme Fear), per Alternative.me, April 12, 2026. Bettors hedge with USDT at $1.00 USD. XRP at $1.33 USD (down 1.8%); BNB at $596.17 USD (down 1.9%).
Sportsbooks spend $500 million USD yearly on analytics (Huddle reports). Sharp NFL draft data visualization separates winners.
Principles for NFL Draft Data Visualization
Use pre-attentive attributes: position for clusters, size for magnitude. Avoid hue for rankings.
Test lie factors. Align scales in small multiples. A 10% change shows 10% visually.
Iterate with users. Scouts like slope graphs; quants prefer density plots.
Verify AI visuals against raw data. Heatmaps may hide tape-confirmed outliers.
These NFL draft data visualization principles apply to sports and finance stock screens alike.


