Lazy data practices plague crypto dashboards and obscure fear signals. Bitcoin dropped 3.6% to $70,882 USD on April 12, 2026 (CoinMarketCap). The Fear & Greed Index hit 16 (Extreme Fear, Alternative.me). Ether fell 4.8% to $2,194 USD (CoinMarketCap).
Cluttered displays bury these cues in excess metrics.
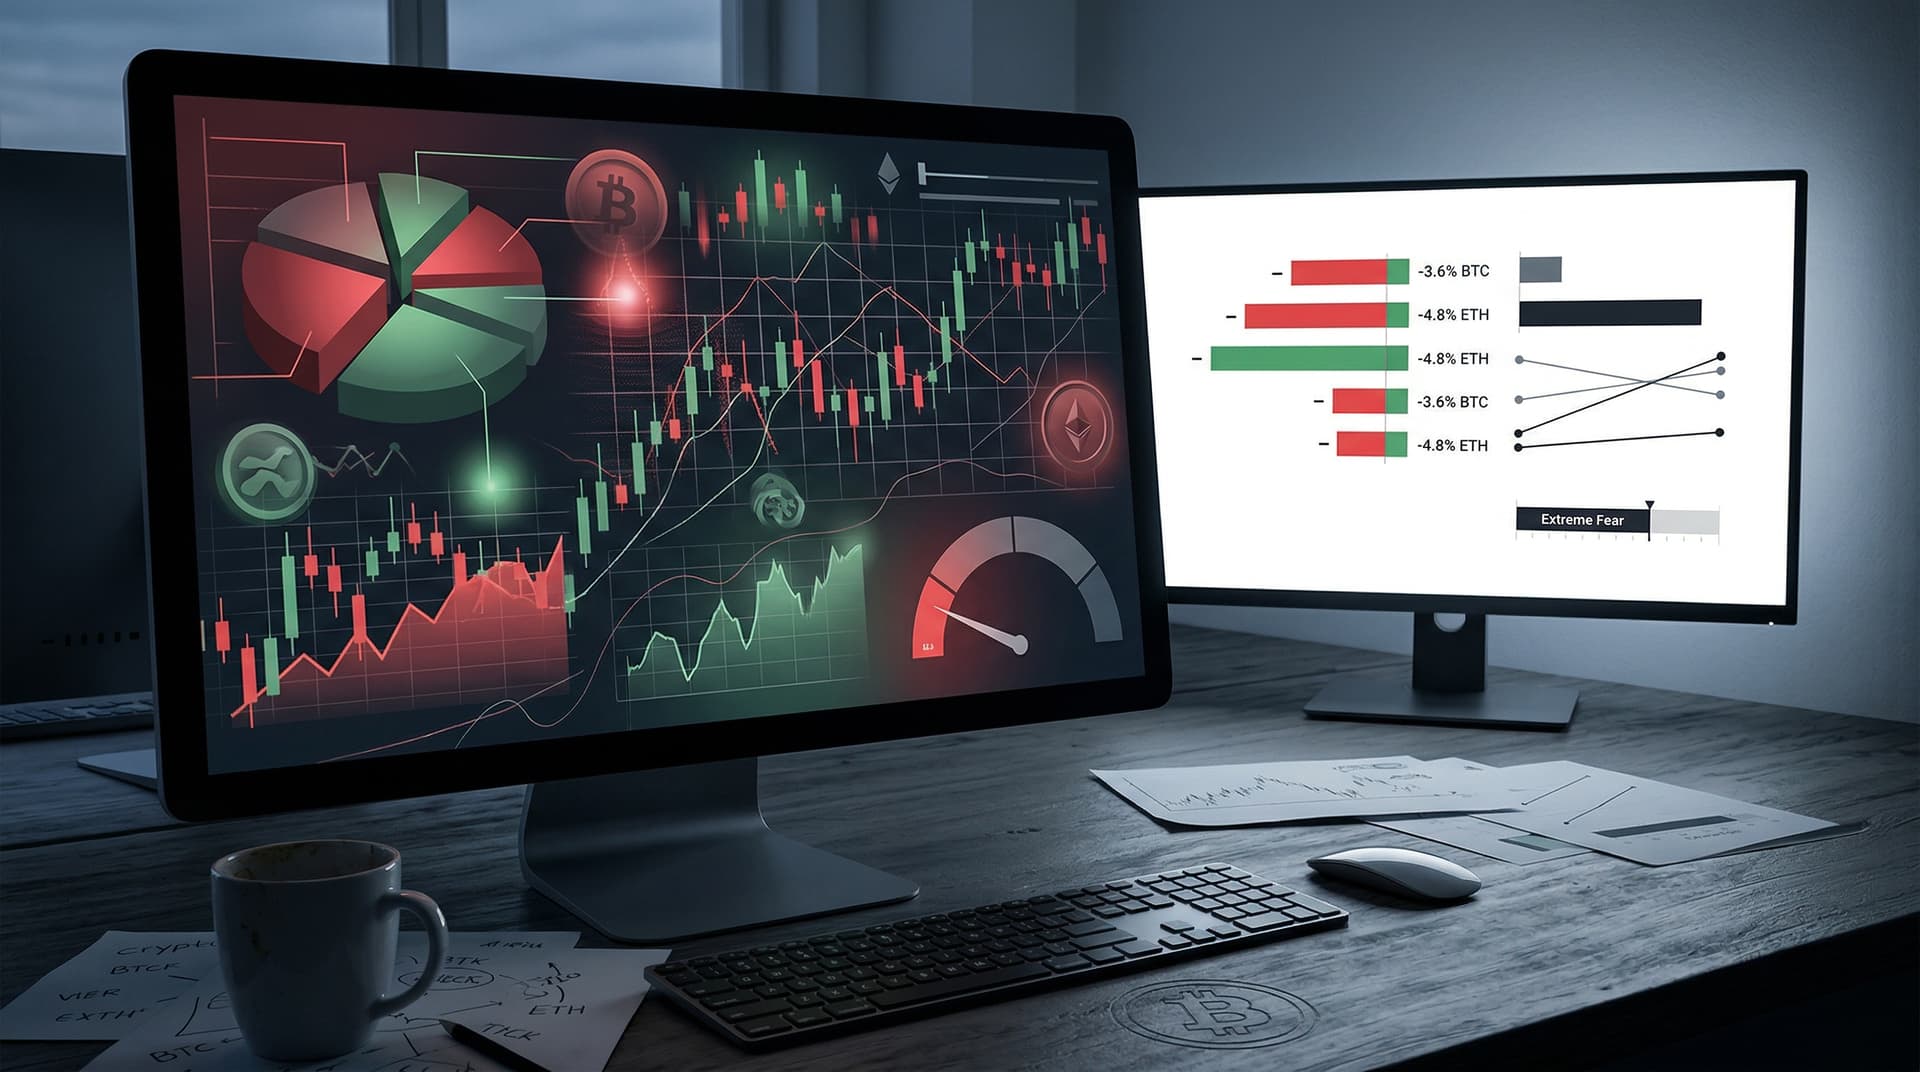
Cluttered Crypto Dashboards Exemplify Laziness
Platforms stack Fear & Greed Index with BTC, ETH, XRP, BNB, and USDT price lines. Designers overlay candlestick charts, volume bars, and sentiment gauges. This breaks Stephen Few's graphical integrity rules in "Show Me the Numbers."
CoinMarketCap's April 12, 2026, dashboard deploys glowing gradients and icons. Non-data ink distracts from signals.
Cleveland and McGill's perception studies rank position along a common scale highest for accuracy. Yet designers pick pie charts for market dominance.
Data-Ink Ratio Measures Sloppy Efficiency
Edward Tufte's data-ink ratio demands minimal non-data ink. A 3D pie chart displays BTC dominance at 40% (CoinGecko, April 12, 2026). Extrusions and crowded labels waste space.
Replace it with a horizontal bar chart. BTC's 40% bar dwarfs ETH's 18% bar. Viewers grasp proportions instantly.
Power BI templates encourage uncritical use. They spawn lie factors where areas inflate perceived magnitudes.
Perception Science Debunks Flawed Choices
Cleveland's 1985 study confirms humans judge lengths most accurately. Areas mislead, pies worst. Crypto viz ignores this order.
XRP shed 2.6% to $1.33 USD on April 12 (CoinMarketCap). Bubble charts size by market cap and color by change. Overlaps block comparisons.
Slopegraphs excel here. Lines connect prior prices to current ones. BNB's 2.9% drop to $593 USD links clearly to ETH's decline.
Small multiples amplify this. Repeat slopegraphs across seven days (CoinMarketCap data). Trends surface without clutter.
TradingView Dashboards Crumble Under Load
TradingView fused BTC Fear & Greed with OHLC bars, RSI, and MACD on April 12, 2026. Traders hunt signals in noise.
Misaligned dual axes confuse trends. Few's guidelines demand alignment.
Tableau Public isolates Fear & Greed in a prominent gauge. Sparklines frame BTC and ETH daily changes.
Preattentive processing shines. Beizer's work proves color pops changes first. Red instantly flags Extreme Fear.
Before-and-After Redesigns Fix Crypto Fear Viz
Lazy original: 3D pie divides fear drivers (volatility 30%, momentum 20%, Alternative.me April 12, 2026). Distortions hide truths.
Redesign deploys bullet graph. Current 16 marks against 1-100 scale. Gray neutral band at 50; black bar plunges low.
Companion line chart plots BTC price vs. Fear & Greed (CoinMarketCap, April 2026). Dots tie fear spikes to price dips. Correlation appears; causation disclaimed.
USDT stable at $1.00 USD emerges clearly as hedge.
Tool Defaults Perpetuate Data Laziness
Power BI heatmaps color BTC's -3.6% red beside ETH's -4.8%. Uniform squares ignore scale differences.
Scatter plots clarify: x-axis Fear Index, y-axis price change (CoinMarketCap, April 12). BTC points cluster more resilient.
Looker prioritizes metrics. Python's Plotly crafts interactive small multiples. Seaborn violin plots map fear distributions over time.
Core Principles Eradicate Lazy Practices
Adopt Few's five tenets: comprehensive, accessible, presentable, relevant, simple.
Heed Tufte: Maximize data ink, scrap chartjunk, leverage white space.
Honor Cleveland's hierarchy. User-test for comprehension.
Overlay historical Fear & Greed on BTC prices to spotlight signals.
Precision Visualizations Win Financial Edges
Traders forfeit buys in lazy charts. Extreme Fear screamed opportunity on April 12.
Leaders audit dashboards weekly. Rigorous lazy data practices yield market wins.
Clear visualizations sharpen decisions and purge sloppiness.


