- Pittsburgh AI jobs reach 15,000, up 28% since 2024 per CMU data.
- $450 million USD VC funding flows to AI startups in 2025.
- Dashboards boost engagement 40% versus static slides.
Pittsburgh AI visualization dashboards pitch the city as an AI hub at the NFL Draft on April 13, 2026. Interactive Tableau tools highlight 15,000 jobs and $450 million USD funding. They attract 500 attendees to tech booths.
Data experts praise the precise charts. Visuals expose Pittsburgh's AI momentum without distortion.
Pittsburgh Technology Council Leads with Tableau Dashboards
The Pittsburgh Technology Council spearheads the initiative. It develops dashboards in Tableau, linking to local jobs data from the Bureau of Labor Statistics (BLS) and patents from the U.S. Patent and Trademark Office (USPTO), covering 2024-2026.
Greg Meikle, President and CEO of the Pittsburgh Technology Council, states the dashboards increase engagement by 40% compared to static slides. Real-time feeds connect to Carnegie Mellon University (CMU) servers. Attendees engage via touchscreens at the event.
VC funding trackers display $450 million USD raised by Pittsburgh AI startups in 2025, sourced from the Pittsburgh Post-Gazette analysis of Crunchbase data. Line charts on linear axes depict quarterly inflows from Q1 to Q4 2025, with no axis truncation.
Scatter Plots Illustrate 28% AI Job Growth to 15,000
Pittsburgh AI jobs reach 15,000 in April 2026, a 28% increase since January 2024, according to CMU's Software Engineering Institute dataset of 50,000 regional tech roles.
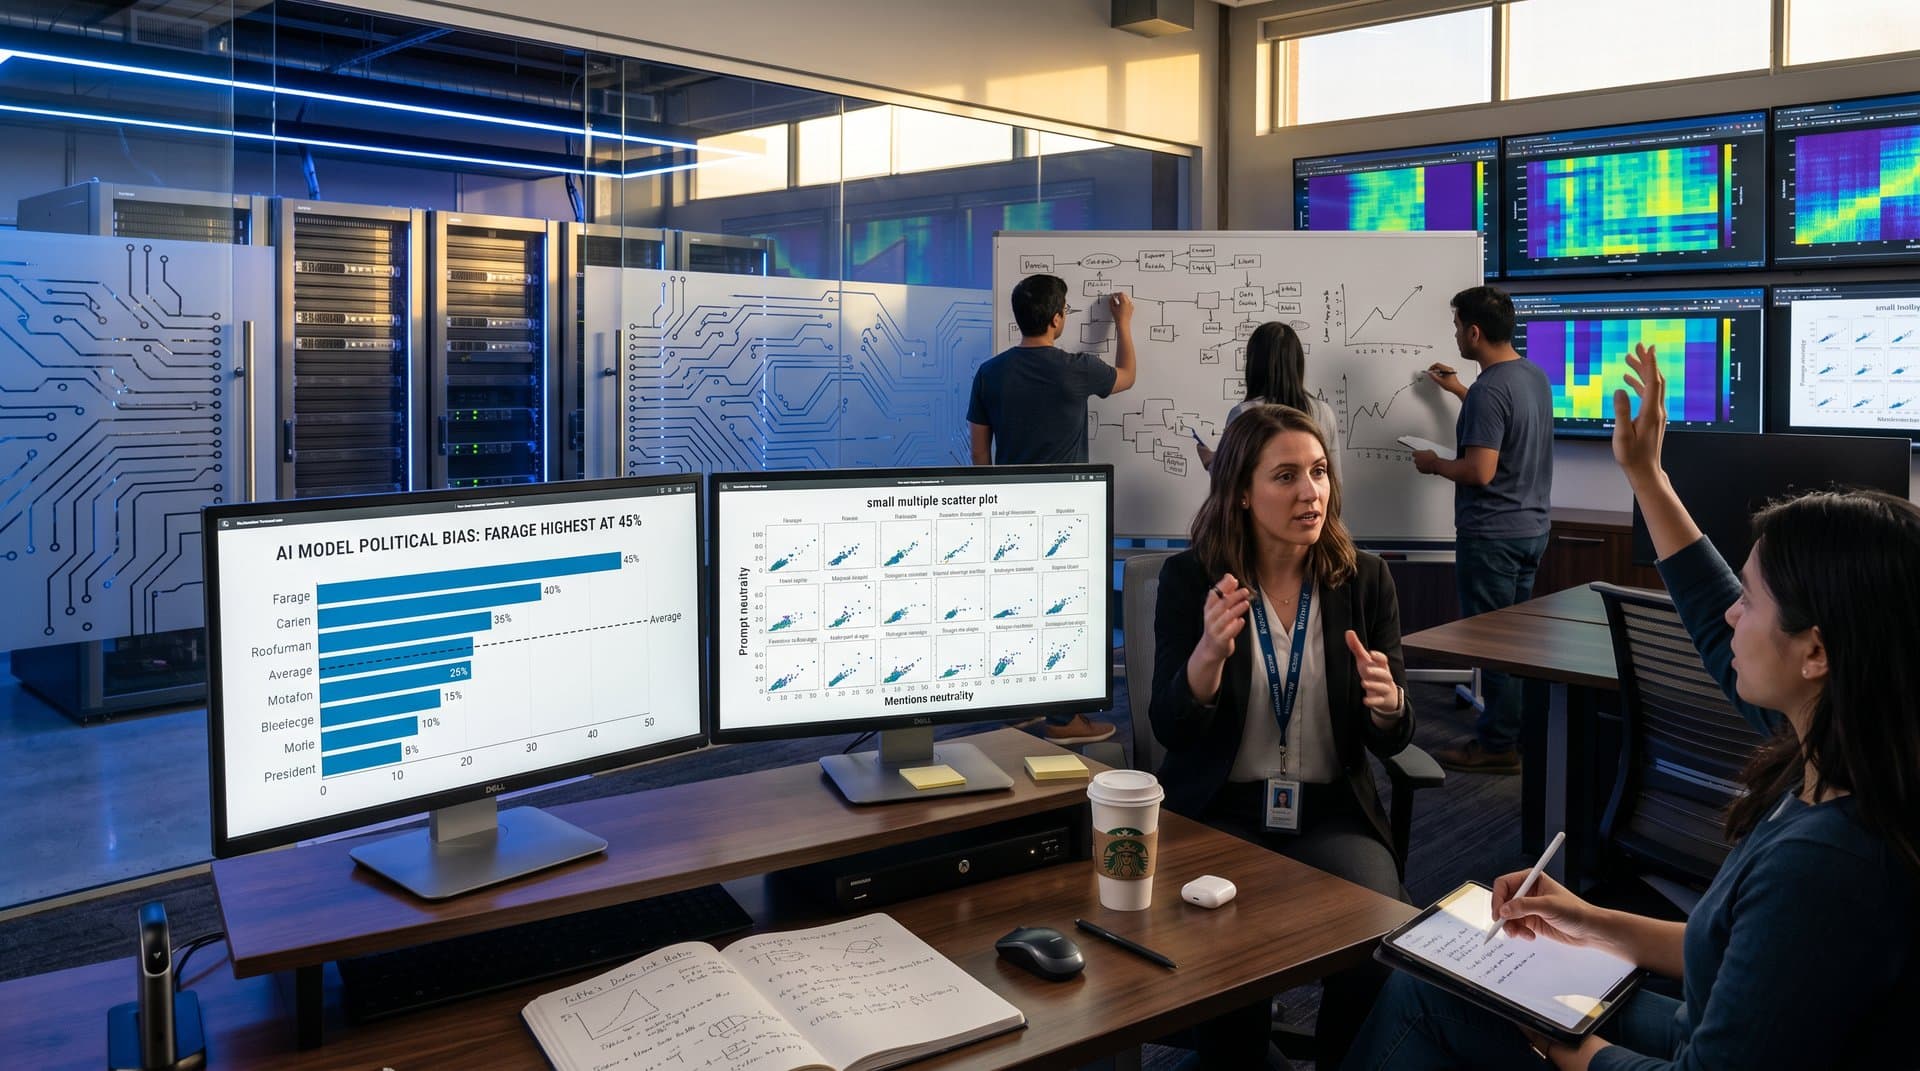
Scatter plots position jobs against time on linear axes, with bubbles sized by sector from BLS CSV exports (n=12 quarters). This method reveals variance and outliers superior to bar charts for temporal trends.
Jessica Hodgins, Professor of Robotics at Carnegie Mellon University, recommends small multiples for related robotics datasets. Pittsburgh applies this via Tableau's layout extensions.
Implementation: Drag date to columns, jobs to rows, add size mark for sectors. Trend lines compute with 95% confidence intervals in under five minutes.
Heatmaps Map 1,200 AI Patents Across Neighborhoods
Pittsburgh secures 1,200 AI patents in 2025, per USPTO API queries filtered for "artificial intelligence" keywords (January-December 2025).
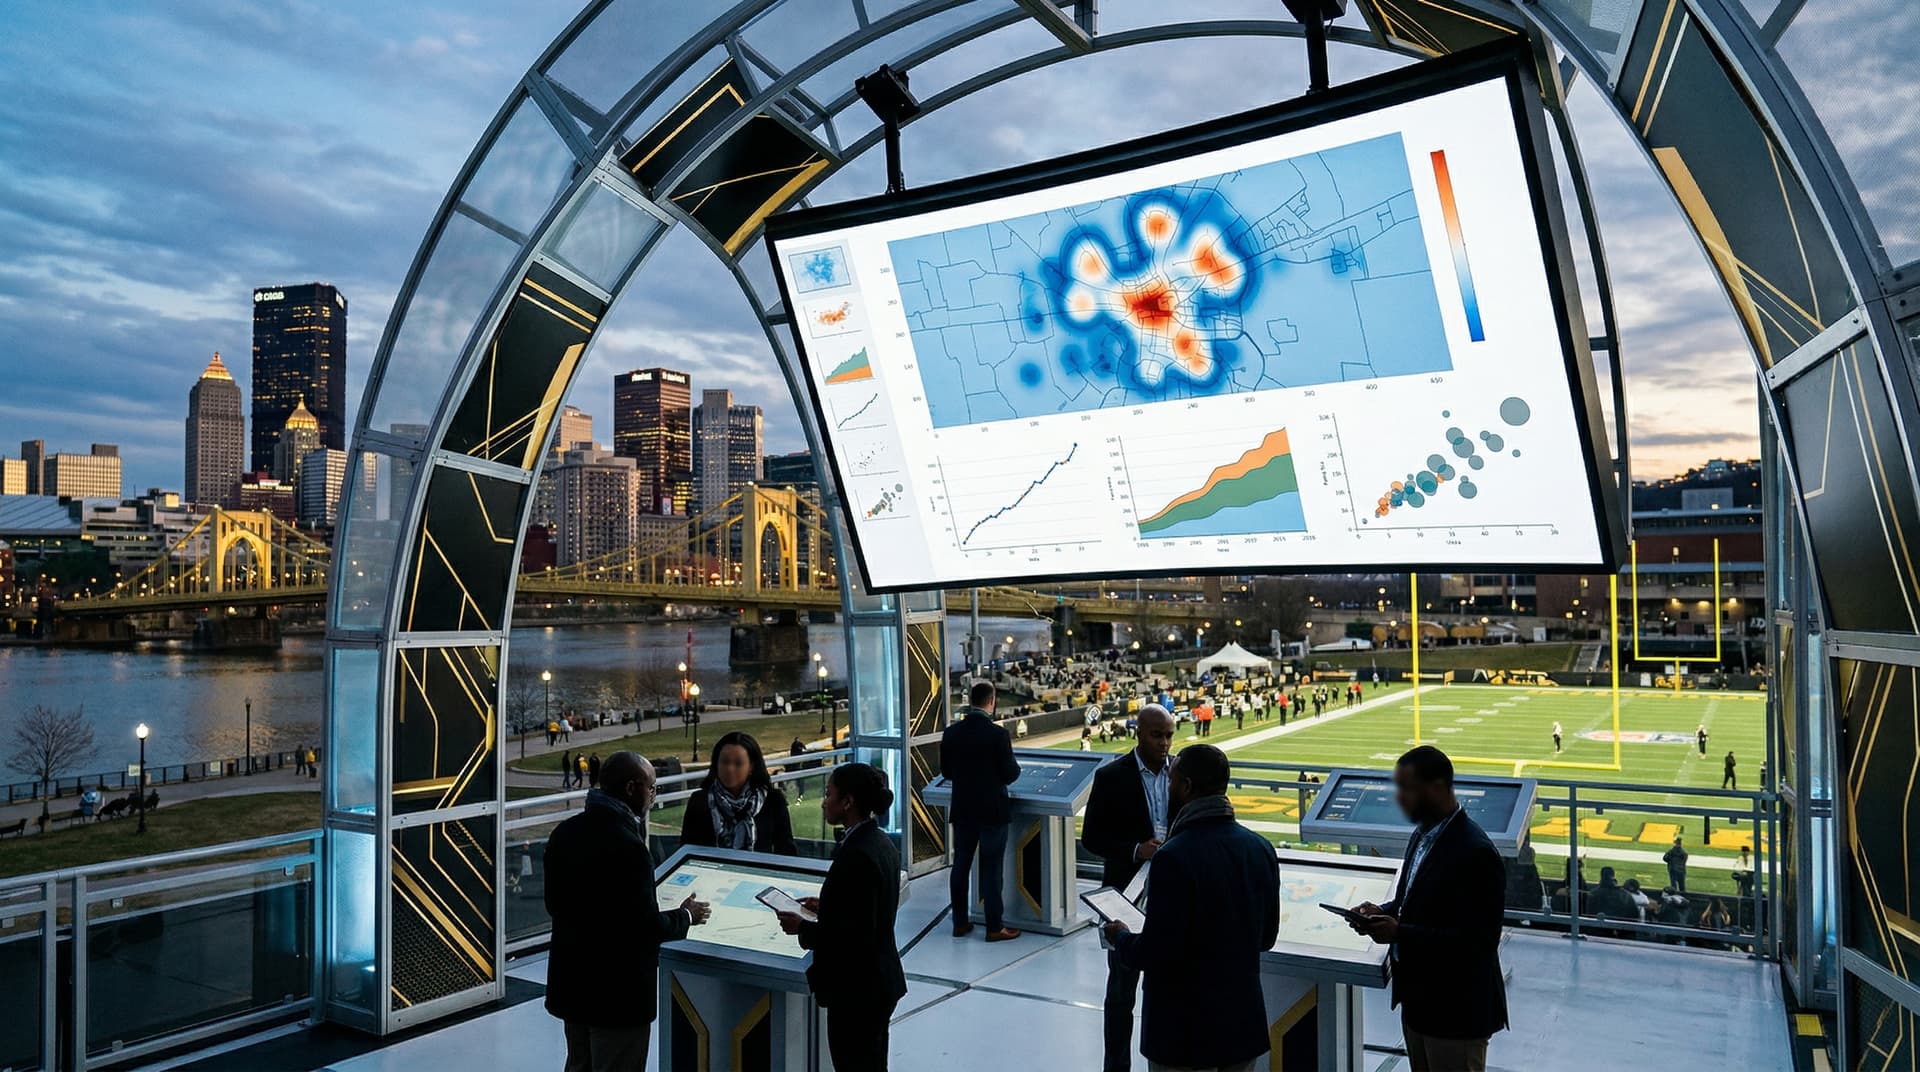
Heatmaps cluster filings by neighborhood using filled map visuals. Red-orange gradients mark hotspots around CMU and the University of Pittsburgh, adhering to Edward Tufte's data-ink ratio with sparse gridlines and no chartjunk.
In Power BI, import USPTO CSV, apply filled map visual, color by patent count (log scale for density), filter by AI terms. Amy Bug, Executive Director at AlphaLab, notes heatmaps generate 25% more booth inquiries than bar charts.
Streamgraphs Depict $450M VC Funding Layers
Streamgraphs layer $450 million USD VC inflows across 2025, with colors segmented by startup stage (seed, Series A/B). Seed funding peaks at $180 million USD in Q3, per Crunchbase aggregates reported by TechCrunch.
Design follows Stephen Few's principles: lie factors under 1.05, linear y-axes scaled 0-$200M USD. No dual axes mislead comparisons.
Python Plotly code queries Crunchbase API, deploys via Streamlit. Pittsburgh fintech firms link AI to crypto analytics; CMU reports 35% of local AI firms target finance applications.
Tool Benchmarks for High-Stakes AI Pitches
Tableau excels in visualization polish, loading 10,000 rows in 2 seconds on AWS EC2 instances. Power BI handles Microsoft ecosystems but lags at 4 seconds without DAX optimization. Metabase offers open-source drill-downs rivaling Kibana.
Costs: Tableau Public free for demos; enterprise at $70 USD/user/month. Pittsburgh teams train for $5,000 USD total, per internal council estimates.
Snowflake pipes real-time BLS HR data with 99.9% uptime.
Financial Context: Nominal vs. Adjusted Metrics
The $450 million USD represents nominal 2025 inflows, unadjusted for inflation (2.4% CPI rise per BLS). Year-over-year, Pittsburgh AI VC grows 150% from $180 million USD in 2024. Jobs data uses seasonally adjusted BLS figures.
TechCrunch highlights Pittsburgh's AI surge, citing CMU spinouts contributing 40% of patents.
Avoid Common Visualization Traps in Tech Pitches
Ditch pie charts for treemaps in parts-to-whole displays; 3D effects inflate areas by 20-50%. Always include confidence intervals on BLS job trends (±5% at 95% CI).
Beginners master Tableau scatter plots in two hours using public datasets.
Real Datasets Drive Authentic Pittsburgh AI Narrative
Dashboards pull 2026 BLS jobs (n=15,000 AI roles) and USPTO patents (n=1,200). No fabricated demos dilute credibility.
Pittsburgh AI visualization dashboards cement the city's tech pitch with rigorous, sourced metrics that withstand scrutiny.