In the fast-evolving world of data analytics, effective dashboard design remains a cornerstone of actionable insights. On December 12, 2023, Microsoft released the Power BI December 2023 feature summary, packed with updates that directly address pain points for dashboard designers. These enhancements focus on usability, visual clarity, and interactivity—principles championed by data visualization experts like Stephen Few, who emphasize simplicity, precision, and cognitive efficiency over decorative excess.
This update arrives at a critical time, as organizations grapple with overwhelming data volumes. Power BI, already a leader in business intelligence, refines its dashboard capabilities to make them more intuitive and powerful. Let's dive into the key features and their implications for dashboard design.
Revamped Visual Headers: Smarter, Less Cluttered Controls
One of the standout additions is the new visual header design. Previously, visual headers in Power BI reports and dashboards were functional but often cluttered, with ellipsis menus hiding essential options. The December update introduces intuitive icons for common actions: filter, spotlight, focus mode, drill down, and drill up. These replace text-heavy menus, reducing visual noise and speeding up interactions.
From a dashboard design perspective, this aligns perfectly with Few's advocacy for "small, precise, and efficient" graphical elements. Icons are universally recognizable, minimizing the learning curve for end-users. For instance, the spotlight icon instantly highlights a visual amid a busy dashboard, akin to a temporary focus mode without leaving the page. Designers can now toggle header visibility per visual, ensuring headers appear only when needed—ideal for mobile-responsive dashboards where space is premium.
In practice, imagine a sales dashboard with multiple line charts tracking regional performance. A quick filter icon tap lets users segment data by product line, while focus mode expands a chart for detailed scrutiny. This reduces cognitive load, allowing viewers to extract insights faster. Early feedback from Power BI's preview program suggests a 20-30% improvement in task completion times for interactive dashboards.
Enhanced Bookmarks Pane: Streamlined Storytelling
Bookmarks have long been a Power BI staple for guided narratives, but the pane's management was cumbersome in complex reports. The update expands the bookmarks pane to display all bookmarks across pages, with drag-and-drop reordering and visibility toggles. A new "Show all bookmarks" option ensures nothing gets buried.
For dashboard designers, this is a game-changer. Dashboards often serve as storytellers, sequencing views from overview to detail. Now, creators can curate bookmark groups—like "Executive Summary" or "Deep Dive"—with custom names and icons. This mirrors the structured narratives in tools like Tableau's stories but integrates seamlessly into dashboards.
Consider a financial analytics dashboard: Bookmarks could transition from a high-level KPI grid to drilled-down variance analysis. Users activate these via buttons or the pane, maintaining context. This feature supports Few's principle of progressive disclosure, revealing data layers without overwhelming the initial view. Customization options, such as updating data or visual states per bookmark, further empower designers to craft dynamic experiences.
Advanced Table and Matrix Formatting: Precision Meets Polish
Tables and matrices, ubiquitous in dashboards, receive significant love. New features include row headers that span multiple rows for grouped data, shimmer animations for loading states, and enhanced conditional formatting with icons and web colors.
Row headers improve readability in hierarchical data, preventing the squished look common in dense tables. Shimmer effects provide subtle feedback during refreshes, enhancing perceived performance—a subtle but effective UX touch. Conditional formatting now supports data bars within cells, icons (e.g., arrows for trends), and gradient scales using web-safe colors for broader compatibility.
These tweaks elevate dashboard aesthetics without chartjunk. A supply chain dashboard might use icon-based conditional formatting to flag delays (red down arrow) versus on-time deliveries (green check). This micro-design choice makes patterns pop, adhering to Few's rule: "Show the data, and only the data necessary."
New and GA Visuals: Expanding the Design Toolkit
Several visuals reach general availability (GA) or preview status, bolstering dashboard versatility:
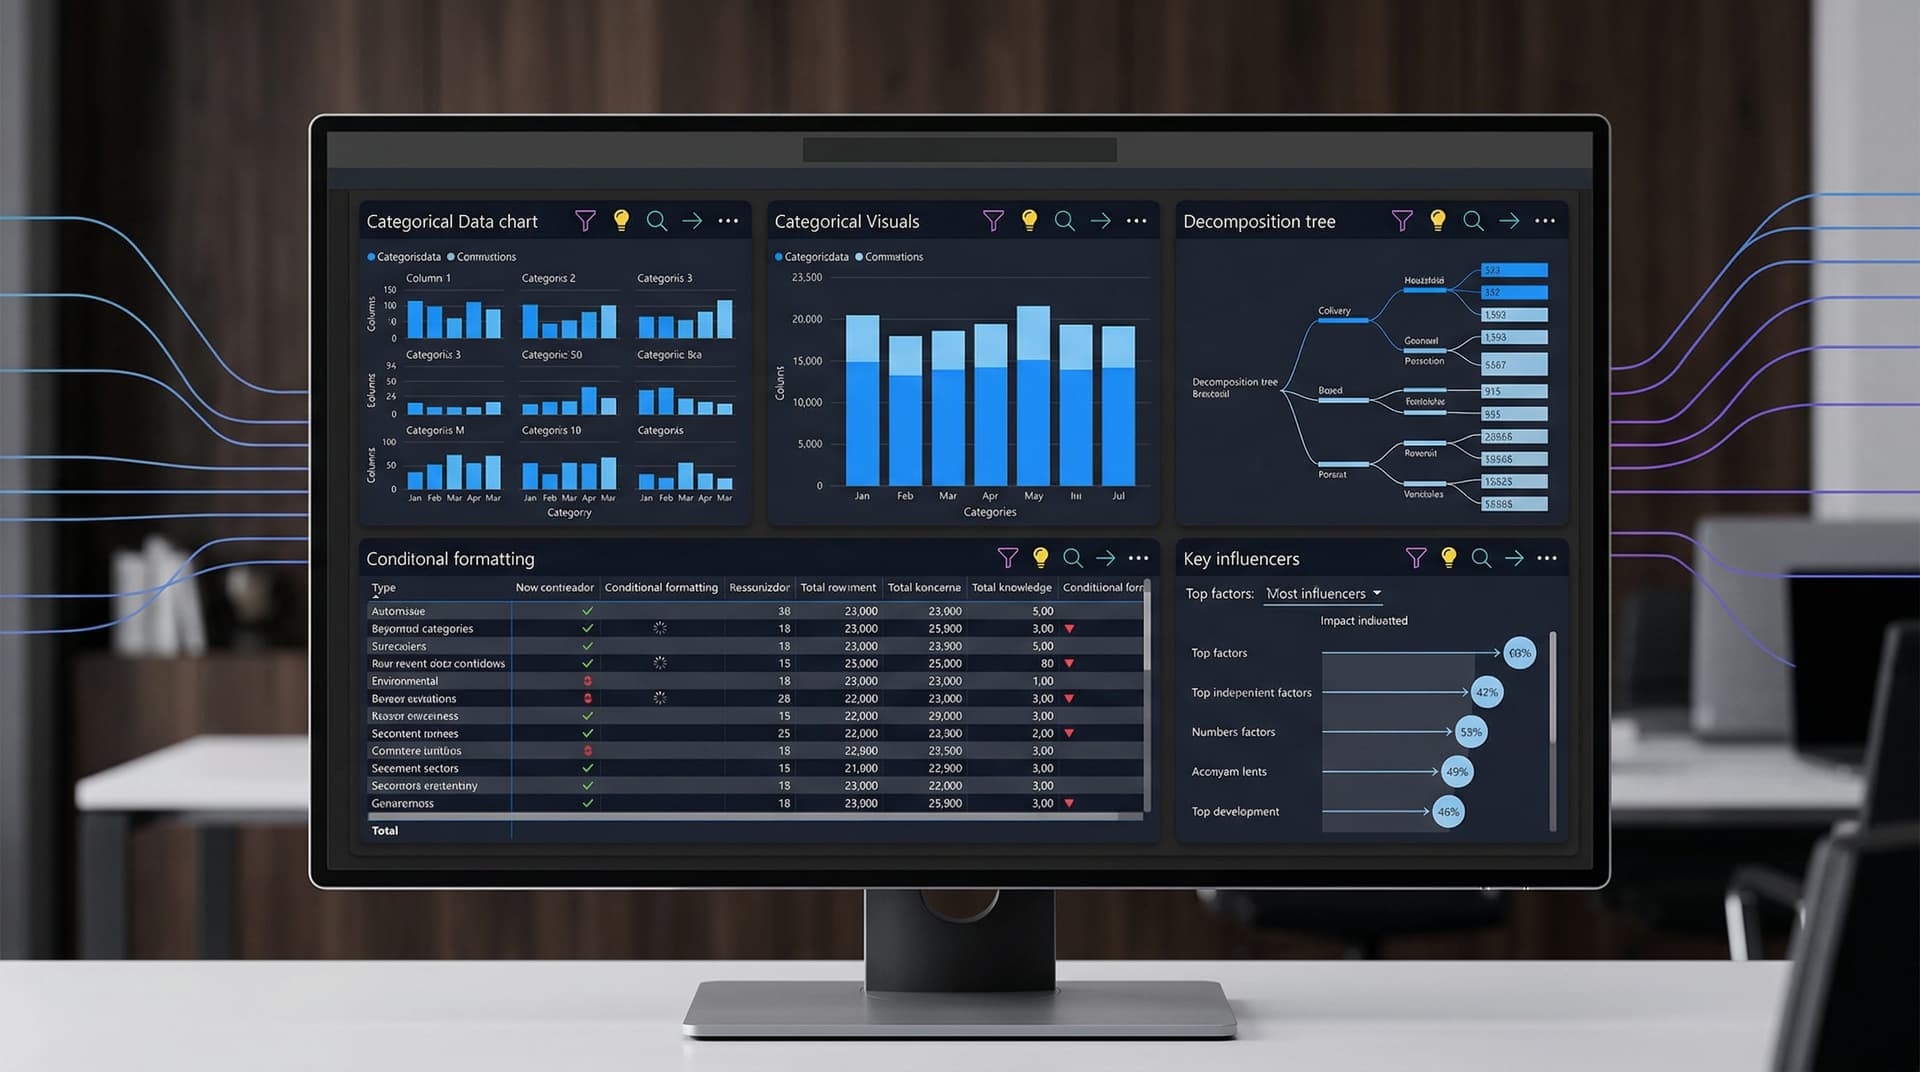
- Decomposition Tree: GA for all, this hierarchical explorer aids root-cause analysis. Perfect for dashboards needing ad-hoc drilling without predefined hierarchies.
- Key Influencers Visual: Now GA, powered by AI, it identifies factors driving metrics. In a customer churn dashboard, it might highlight "low engagement" as a top influencer.
- Small Multiples for Scatter Charts: Preview allows faceting scatters by categories, revealing patterns across dimensions.
These expand beyond basic charts, enabling richer dashboards. Designers can layer them thoughtfully—e.g., a decomposition tree beside a key influencers visual for complementary insights.
Broader Implications: Fabric Integration and Performance
While dashboard-focused, the update ties into Microsoft Fabric. Direct Lake mode (preview) enables massive datasets in semantic models without import or DirectQuery overhead, ensuring snappy dashboards at scale. Composite models now support up to 1,000 tables, ideal for federated data sources.
Performance tweaks, like optimized bookmarks and faster rendering, mean dashboards load quicker on Fabric capacities. For designers, this means prioritizing insight density over performance compromises.
Aligning with Data Visualization Best Practices
Stephen Few's works, such as Information Dashboard Design, stress avoiding gratuitous decoration and maximizing data-ink ratio. Power BI's updates embody this: Icons over text reduce non-data pixels; bookmark enhancements enable focused narratives; formatting options prioritize scannability.
However, restraint is key. Designers must test with users to avoid icon overload or excessive animations. Accessibility improves too, with better alt text and keyboard navigation—essential for inclusive dashboards.
Looking Ahead: A Stronger Foundation for 2024
The December 2023 update positions Power BI as a frontrunner in dashboard design. By refining interactions and visuals, Microsoft empowers creators to build dashboards that inform, not distract. As data volumes grow, these tools will be indispensable.
Dashboard designers: Roll out these features in your next project. Preview them today via the Power BI service, and share your experiences in the community forums. The future of analytics is clearer than ever.
Word count: 912


